Analytics Services
Analytics helps companies decide where and when to launch new products, when to offer discounts, and when to market in new areas.
Data analysis is the process of interpreting data that leads to meaningful decisions. Data analysis is a small part of data analytics. Data analytics uses raw data captured from many sources to process, analyze, and interpret what may happen and how an organization can use this knowledge for its benefit.
There are four types of analytics:
- Descriptive analytics helps answering "What happened?". It provides insights into trends and patterns. It uses data visualization.
- Diagnostic analytics is characterized by techniques, such as drill-down, data discovery, data mining, and correlations.
- Predictive analytics answers the question of "What might happen?". It uses historical data and statistical algorithms to make forecasts about future outcomes. It includes machine learning, forecasting, pattern matching, and predictive modeling.
- Prescriptive analytics is based on predictive analytics, to actually recommend actions or responses to the predicted outcome. It includes machine learning, graph analysis, simulation, complex event processing, neural networks, and recommendation engines.
The AWS portfolio of fully managed analytics services includes a cloud-native big data platform, a log analytics and search engine for operational data and a distributed streaming platform for real-time data movement.
Document history
Created Nov 23 - Updated 01/30/2024
Domain Knowledge
Each enterprise has data management platform challenges to be able to increase volumes, velocity and variety of data.
Data an analytics domain of knowledge addresses the following subjects.
Data Collection
Data collection is gathering data from multiple sources to a single store.
- Evaluate costs associated with data acquisition, transfer, and provisioning from various sources into the collection system.
- Determine data persistence at various points of data capture.
- Identify the latency characteristics of the collection system.
- Select the data collection solution
Storage and data management
Structured and semi-structured data are stored in database, while unstructured data are in data lakes. Transactional databases are called OLTP (online transaction processing) databases. In an OLTP system, the most common queries are called lookup queries. OLAP (online analytical processing) is associated more with aggregate queries that only need a few columns.
- Determine data access and retrieval patterns.
- Select appropriate data layout, schema, structure, and format.
- Define data life cycles based on usage patterns and business requirements.
Data processing
Data transformation is the formatting, organizing, and controlling of data.
- Design a solution to transform and prepare data for analysis, applying appropriate ETL or ELT techniques. With ELT, all data cleansing, transformation, and enrichment occur within the data warehouse.
- Implement failover, scaling, and replication mechanisms.
Analysis and Visualization
Data security
- Apply data governance and compliance controls.
AWS Athena
AWS Athena runs analytics directly on S3 files or federated storage, using SQL language to query the files (CSV, JSON, Avro, Parquet...). S3 Access Logs log all the requests made to buckets, and Athena can then be used to run serverless analytics on top of the logs files.
- No need to load the data to Athena, the query is executed on top of S3.
- Based on Presto for DML queries and Apache Hive for datawarehouse and SQL queries.
- Queries are done on high availability capability so will succeed, and scale based on the data size.
- No need for complex ETL jobs to prepare our data for analytics.
- Athena integrates with Amazon QuickSight for easy data visualization.
- Integrated with AWS Glue Data Catalog, allowing us to create a unified metadata repository across various services, crawl data sources to discover schemas and populate our Catalog with new and modified table and partition definitions, and maintain schema versioning.
- Pricing pet TB of data scanned.
-
It also includes
Federated Queryto run SQL queries across data stored in relational and non-relational , object, and custom data sources. It uses the Data Source Connectors which executes a Lambda to run the Federated Query. -
Prefer using Apache Parquet data format for better performance and optimized cost. It is a columnar file format that provides optimizations to speed up queries and is a far more efficient file format than CSV or JSON
- Partition our data in S3 folder.
CSV to Parquet
For Python, Pandas support it by reading the csv file into dataframe using read_csv and writing that dataframe to parquet file using to_parquet. Apache Drill has also such tool. In Spark the data frame has write.parquet API. Finaly AWS Glue can also do such transformation.
Simple demo script
- Create a S3 bucket to keep results of Athena queries.
- Create a second S3 bucket to keep source data, and upload a csv file as data source.
-
Create a database in Athena:
CREATE DATABASE mydatabase -
Define SQL query to create table to match the source (external table) and run it in the Editor.
CREATE EXTERNAL TABLE IF NOT EXISTS tablename-datasource ( `Date` DATE, Time STRING, Location STRING, ... ) ROW FORMAT DELIMITED FIELDS TERMINATED BY ',' LINES TERMINATED BY '\n' LOCATION 's3://url-to-bucket' -
Use the SQL query Editor to select columns, do any type of query.
Lambda example
It is possible to run Athena query from Lambda function and get the result pushed in an output S3 bucket or in another place.
See the lambda code in the labs/lambdas/s3-aurora folder.
Also see the boto3 Athena API.
Deeper dive
- Product documentation
- Getting started with Athena
- How do I analyze my Amazon S3 server access logs using Athena?
- See also code sample.
- Calling SageMaker function from an Athena Query to do ML.
AWS Batch
As a fully managed service, AWS Batch helps to run batch computing workloads of any scale across multiple AZs within a region.
Job definition specifies how jobs are to be run, and it can use container image.
A compute environment is a set of managed or unmanaged compute resources (Fargate or EC2) that are used to run jobs. For EC2 it uses a dynamic provisioning with option to use Spot instances.
A job queue stores the submitted jobs until the AWS Batch Scheduler runs the job on a resource in the compute environment.
It used EBS for temporary storage.
Can be scheduled with EventBridge schedule, can also being orchestrated with Step function.
QuickSight
Dashboard tool, serverless, machine learning powered BI service.
Two type of persona: dashboard developers and end-users (read-only on the dashboard).
Integrated with RDS, Aurora, Athena, S3, RedShift, OpenSearch, Timestream, with Saleforce, Jira... It can integrate to any JDBC compliant database. It can import CSV, XLSX, JSON, TSV files and log files.
If data is imported inside QuickSight, it uses in memory computation using SPICE (Super-fast, Parallel, In-memory Calculation Engine) engine.
The development process is described in the figure below (link to AWS doc)
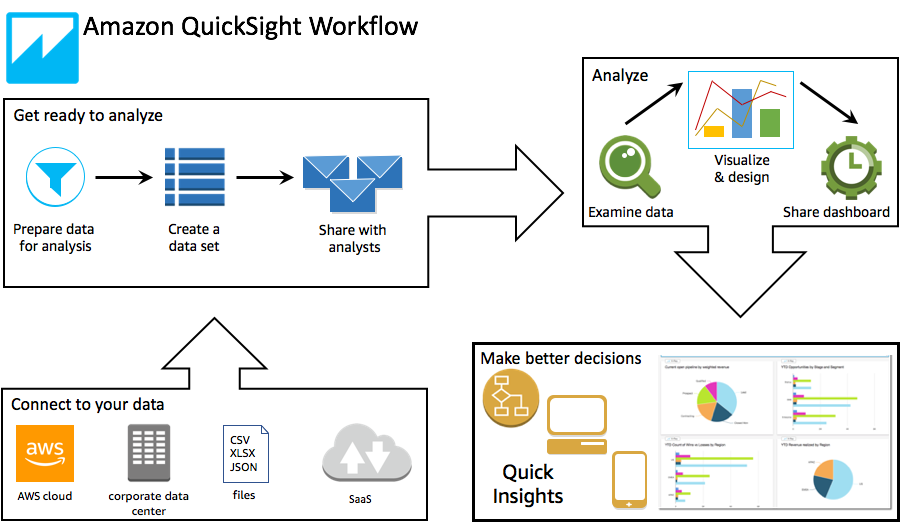
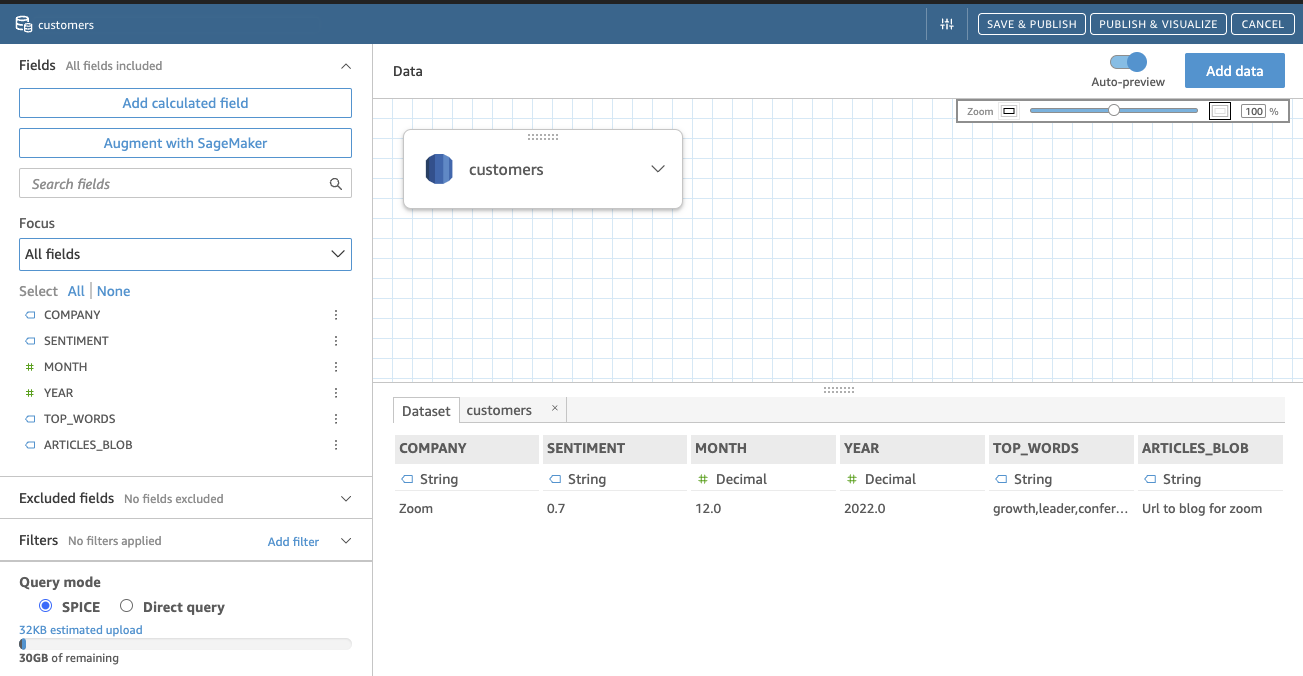
- Defining a dataset and then working in removing column, applying filters, changing field names or data types, adding calculated fields, or use SQL to joins between tables.
Here is an example of integration with a table in Aurora
- Add Visual. A Visual can include multiple dataset and then multiple sheets. An Interactive Sheet is a collection of data expressed in visuals that users can interact with when the sheet is published to a dashboard. A Paginated Report is a collection of tables, charts, and visuals that are used to convey business critical information.

- Create Dashboard from an Analysis.
- Share dashboard so it can be seen by end users.
With enterprise edition we can define groups of users, and share dataset, visual and dashboard with group or individual user.
The dataset can be shared between developers so they can develop their own analysis. Visualizations can also be shared during development, then the readonly dashboard is shared to end users.
To get input data for a dashboard we can define parameters. Parameters can also be used for exchanging context between sheets.
QuickSight can generate smart queries that uses only required tables rather than joining in all tables defined in the dataset.
Some how to
- Invite user using the right top menu (human icon), and Manage QuickSight, then invite people by email. Create Group, and then add users. The 3 letters to search really need to be the first 3 letters.
- Once data are in SPICE, they need to be refreshed from the data source to get the last records updates. A refresh can be scheduled.
- Add trend and add X axis variable coming from the dataset and Value for Y.
- To add a widget to filter the data, use filter, select the column and add it to the current sheet (contextual menu)
- To add a transition from a sheet to another by passing the value of the selected elements.
Deeper Dive
- youtube channel for QuickSight.
- Demo Central - learning
- Very good workshop. 5 stars
- Build your first quicksight dashboard - video
- Embedding Amazon QuickSight dashboards in your applications.
- Embedding Analytics dashboard in application.
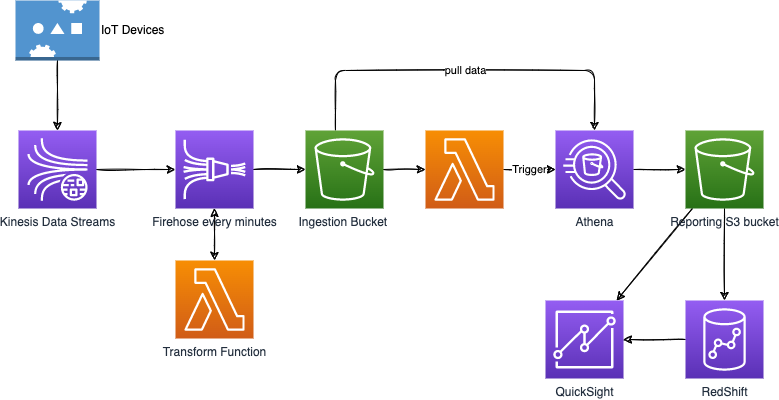
Example of a big data ingestion pipeline
The requirements are:
- Use serverless ingestion pipeline.
- Collect and transform data in real-time.
- Support SQL query on transformed data.
- Persist SQL results into S3.
- Keep into warehouse and create dashboard.
- Data could come from IoT devices
A potential architecture will be: