Job Lifecycle & State Management (App Owners + Platform)¶
1- Deploying New Jobs¶
From zero to running: required configs, resource requests, restart strategies.
There two types of Jobs/Flink application to consider for deployment:
- the java/python application (DataStream or TableAPI)
- the SQL Statements.
Then the target platform will have different mechanism and packaging depending if it is:
- Confluent Cloud for Flink
- Confluent Platform for Flink
- Apache Flink OSS
1.1 Packaged Application Deployment (OSS or CP-Flink)¶
Context¶
The deployment of java packaging is the same between OpenSource and Confluent Platform Flink. So any existing DataStream application will run the same way.
There is only yaml manifest to deploy application that will take into account environment, as applications are grouped within environment.
1.2 SQL Query Deployment on CP-Flink¶
Context¶
Preconditions / Checklist¶
- Be sure to have access to the CMF REST end point: could be localhost
- An environment is defined. (See this note)
- A Catalog is defined - See this note, and see example from this repository
Inputs / Parameters¶
Procedure¶
- Define a database - A database is created within a catalog and references a Kafka cluster. See product documentation
Rollback¶
Gotchas¶
-
For end-to-end validation of CP Flink with the employee demo, see code/flink-sql/00-basic-sql and run
cp_flink_employees_demo.py.
2- Understanding the Flink UI¶
Context¶
The Flink Web UI helps to debug misbehaving jobs.
The Flink Web UI is well described in Confluent David Anderson's article, The Apache Flink doc for Web UI, and link to the important execution plan understanding with EXPLAIN.
Preconditions / Checklist¶
With OSS the Web UI is accessible when the start_cluster.sh is started. Local URL is http://localhost:8081.
Procedure¶
The Web UI offers the following important features:
- Task Managers View: Shows the number of TaskManagers (the worker nodes executing your jobs) and available Task Slots.
- Navigating to get the running Jobs, the view is updated periodically. The job graph, which matches the EXPLAIN output, presents the tasks running one or more operators of the DAG.
- Task metrics are backpressure, busyness, and data skew.
- backpressure: percentage of time that the subtask was unable to send output downstream because the downstream subtask had fallen behind, and (temporarily) couldn't receive any more records.
Backpressured maxis the maximum backpressure across all of the parallel subtasks for a given period. - busy reports percentage of time spent doing useful work, aggregated at the task level for a time period.
- data skew measures the degree of variation in the number of records processed per second by each of the parallel subtasks. 100% is max skew.
- backpressure: percentage of time that the subtask was unable to send output downstream because the downstream subtask had fallen behind, and (temporarily) couldn't receive any more records.
- Examining the history of checkpoints
- Monitoring for any potential backpressure
- Analyzing watermarks
- Retrieving the job logs
Network metrics (Bytes Received / Records Received ) are inside the Flink cluster, not for source and sink to external systems.
In Concluent Cloud the Query Profiler has the same capability then the Flink UI and accessible at the Statement View level: 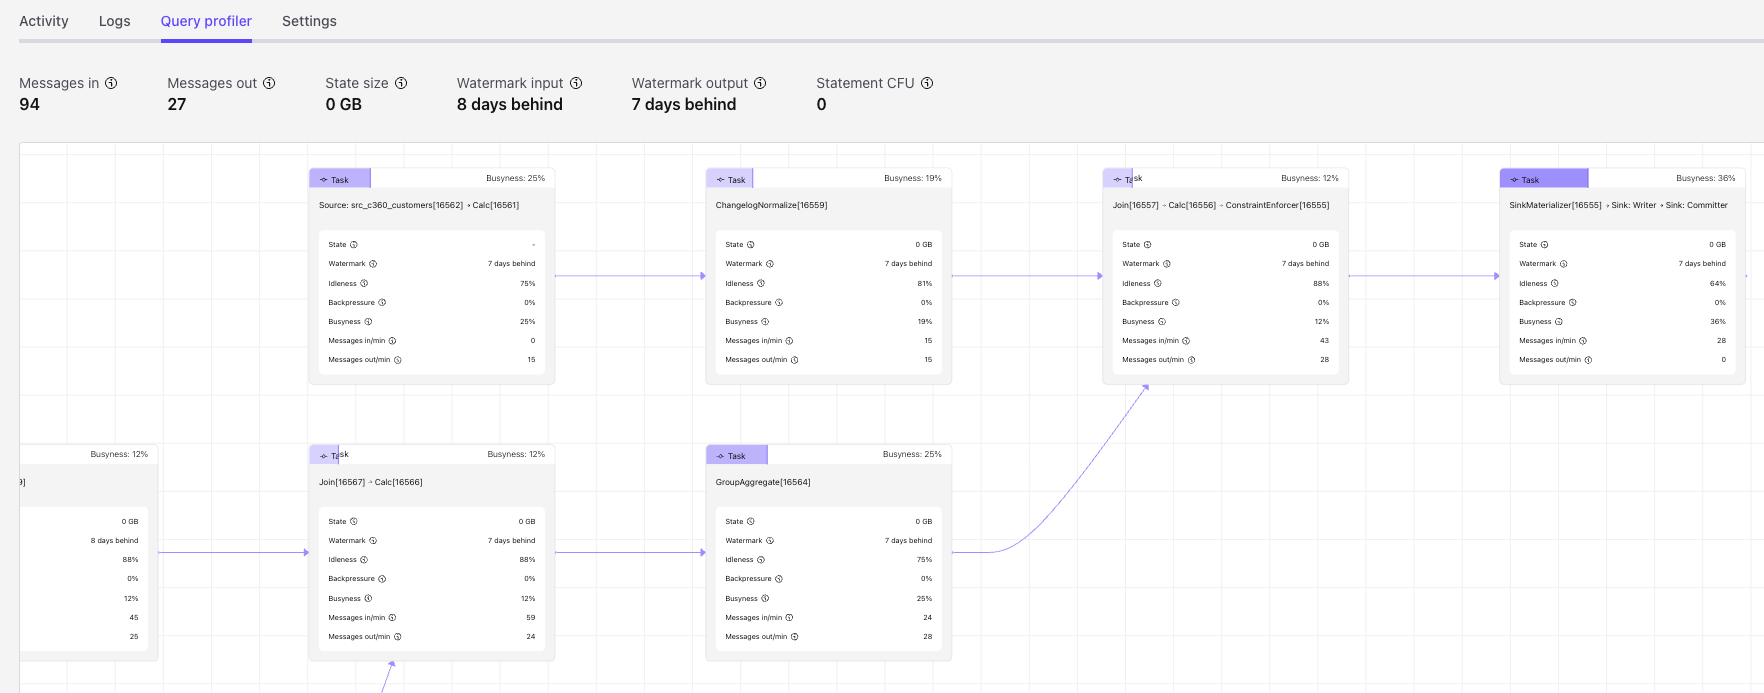
3- Upgrading Jobs Safely¶
Query evolution is a major project subject for any streaming processing. As an example, we are using the following architecture, integrated with Kafka, most likely CDC tables and sink connectors:

Once a Flink query is deployed and run 'forever', how to change it? to fix issue or adapt to schema changes.
Statement Evolution Context¶
The general strategy for query evolution is to replace the existing statement and the corresponding tables it maintains with a new statement and new tables. The process is described in this Confluent Cloud product documentation and should be viewed within two folds depending of stateless or statefulness of the statement. The initial state of the process involves a pipeline of Flink SQL statements and consumers processing Kafka records from various topics.
By principles any Flink DAG code is immutable, so statement needs to be stopped and a new version started! This is not as simple as it may look, as there will be impacts to any non-idempotent consumers.
The Flink SQL statements has limited parts that are mutables. In Confluent Cloud the principal name and compute pool metadata are mutable when stopping and resuming the statement. Developers may stop and resume a statement using Console, CLI, API or even Terraform scripts.
Here are example using confluent cli:
# $1 is the statement name
confluent flink statement stop $1 --cloud $(CLOUD) --region $(REGION)

confluent flink statement resume $1 --cloud $(CLOUD) --region $(REGION)
When a SQL statement is started, it reads the source tables from the beginning (or any specified offset) and the operators, defined in the statement, build their internal states.
Source operators use the latest schema version for key and value at the time of deployment. There is a snapshot of the different dependency configuration saved for the statement: the reference to the dependants tables, user-defined functions...
Any modifications to these objects are not propagated to running statement, which means that:
- A change to the schema of the source topic is not picked up by the running statement that references the topic.
- Same applies to other objects in the catalog like watermark, UDF etc.
First let review the schema definition evolution best practices for Flink processing.
Schema compatibility¶
Flink works best when consuming topics with FULL_TRANSITIVE compatibility mode, which allows addition or deletion of fields with default values only. Fields added are ignored by the running Flink Statement
The following table lists the schema compatibility types, with the Flink impacts:
| Compatibility type | Change allowed | Flink impact |
|---|---|---|
| BACKWARD | Delete fields, add optional field | Does not allow to replay from earliest |
| BACKWARD_TRANSITIVE | Delete fields, add optional fields with default value. | Require all Statements reading from impacted topic to be updated prior to the schema change. |
| FORWARD | Add fields, delete optional fields | Does not allow to replay from earliest |
| FORWARD_TRANSITIVE | Add fields, delete optional fields | Does not allow to replay from earliest |
| FULL | Add optional fields, delete optional fields | Does not allow to replay from earliest |
| FULL_TRANSITIVE | Add optional fields, delete optional fields | Reprocessing and bootstrapping is always possible: Statements do not need to be updated prior to compatible schema changes. Compatibility rules & migration rules can be used for incompatible changes. |
| NONE | All changes accepted | Very risky. Does not allow to replay from earliest |
With FULL_TRANSITIVE, old data can be read with the new schema, and new data can also be read between the schemas X, X-1, and X-2. Which means in a pipeline, downstream Flink statements can read newly created schema, and will be able to replay messages from a previous schemas. Therefore, you can upgrade the producers and consumers independently.
Confluent Schema Registry supports Avro, Json or Protobuf, but Avro was designed to support schema evolution, so this is the preferred serialization mechanism to use.
Handle multiple event types¶
The Confluent documentation presents how to support multiple event types in the same topic. This pattern adds risk to get frequent schema modificatipons and so statement evolution. To summarize this guide:
- The topic is using an envelop schema referencing existing schemas.
- When these schemas are registered in Schema Registry and used with the default TopicNameStrategy, Flink automatically infers the table structure
- Flink supports union of types for example the eventDetails may be of two different types while contextInfo will be the same in all messages
{ "type": "record", "name": "AccountLifecycleEvent", "namespace": "io.confluent.flink.multievent", "fields": [ { "name": "contextInfo", "type": { "type": "record", "name": "EventContext", "fields": [ { "name": "eventName", "type": "string" }, { "name": "correlationId", "type": "string" }, { "name": "sourceSystem", "type": "string" } ] } }, { "name": "eventDetail", "type": [ "io.confluent.flink.multievent.DeviceSwapDetail", "io.confluent.flink.multievent.SubscriptionDetail", "io.confluent.flink.multievent.DeviceCloseDetail" ] } ] } - The SQL to process the record will have condition on the eventDetail type:
- For topics using RecordNameStrategy or TopicRecordNameStrategy, Flink initially infers a raw binary table.
- See multiple-event-type demonstration in this repo.
3.1- Recipe: Safely Upgrade a Flink Job Using Savepoints¶
Upgrade a Production Flink Job with Savepoint (Minimal Downtime)
Context¶
Use this when you need to:
- Deploy a new version of an existing job that MUST PRESERVE state (e.g., aggregations, keyed state).
- Make compatible changes to the job graph (e.g., logic changes without breaking state schemas).
Preconditions / Checklist¶
- You understand whether the change is state compatible:
- No removal/renaming of stateful operators or registered state names.
- No incompatible serialization changes for keyed state / operator state.
- You have:
- Access to Flink’s Web UI and/or CLI (or corresponding managed-service UI).
- Permissions to trigger savepoints and cancel/start jobs.
- Checkpointing is healthy:
- Latest checkpoints successful.
- Checkpoint duration and size stable.
Inputs / Parameters¶
- JOB_ID or stable job name.
- SAVEPOINT_DIR (e.g., s3://my-bucket/flink/savepoints/...).
- New artifact reference (e.g., Docker image tag, jar path).
- Desired parallelism for the new version.
Procedure¶
We assume that the blue records are processed end-to-end, and the upgrade process begins at a specific point, from where all green records to be processed.
For stateless statement evolution the figure below illustrates the process:
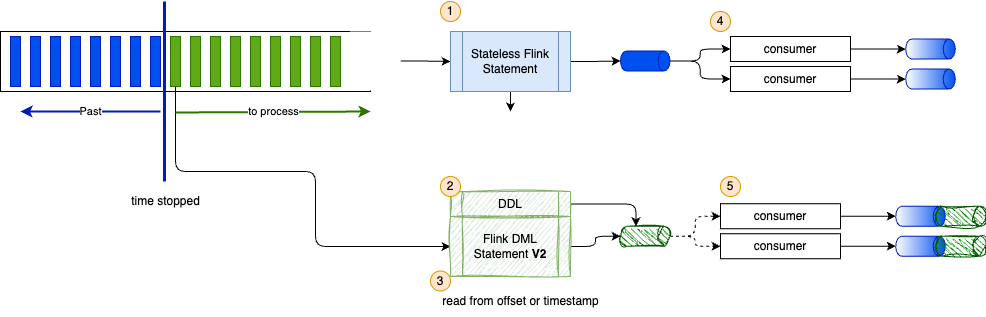
Figure: Stateless schema evolution process
- The blue statement, version 1, is stopped, and from the output, developer gets the last offset
- The green statement includes a DDL to create the new table with schema v2.
- The green DML statement, version 2, is started from the last offset or timestamp and produces records to the new table/topic
- Consumers are stopped. They have produced so far records to their own output topic with source from blue records.
- Consumers restarted with the new table name. Which means changing their own SQL statements, but now producing output with green records as source.
At a high level, stateless statements can be updated by stopping the old statement, creating a new one, and transferring the offsets from the old statement. As mentioned, we need to support FULL TRANSITIVE updates to add or delete optional columns/fields.
- Trigger a Savepoint
- From UI/CLI, trigger a savepoint for the running job, specifying SAVEPOINT_DIR if required.
- Wait until the savepoint finishes successfully and record the savepoint path.
- Cancel the Job with Savepoint (Optional Depending on Platform)
- Either: Cancel-with-savepoint in one operation, or After savepoint completion, cancel the job gracefully.
- Confirm the job is no longer running.
-
Deploy New Job Version from Savepoint
- Configure the new deployment with: Same job name (if your infra relies on it).
- fromSavepoint
(or equivalent UI option). - Updated artifact version.
- Make sure parallelism choices are valid for the state (e.g., beware of keyed state repartitioning).
-
Monitor Startup
- Watch logs and the Flink UI: The job transitions to RUNNING. No StateMigrationException or deserialization errors.
- Confirm that checkpointing restarts successfully.
- Post-Deploy Validation: For at least 10–30 minutes (depending on SLAs):
- Check key metrics: input rate, end-to-end latency, checkpoint status, backpressure.
- Validate downstream data (sanity checks, dashboards, or data-quality rules).
Restart a statement from a specific time or offset¶
Using time window, it may be relevant to restart from the beginning of the time window when the job was terminated. Which means using a WHERE event_time > window_start_time_stamp to get the records from the source table for an aligned time.
Use the /*+ options at the table level or a set statement for all the table to read from.
FROM orders /*+ OPTIONS('scan.startup.mode' = 'timestamp', 'scan.startup.timestamp-millis' = '1717763226336') */
For offset, the status.latest_offsets includes the lastest offset read for each partition. Note that reading from an offset is applicable only for stateless statements to ensure exactly-once delivery. or
Rollback¶
If you detect errors, anomalies, or instability:
- Cancel the new job.
- Restart the previous version from the same savepoint (or the last known good one).
- Confirm successful restore and checkpointing before considering a new upgrade attempt.
Gotchas¶
- Incompatible changes to keyed state serialization often only show up at restore time; always test in staging with a copy of prod state before running this recipe in production.
- If your platform supports “upgrade in place” semantics (e.g., via an operator or managed UI), integrate those flows but preserve this mental model: take consistent state → deploy new logic from that state → validate → rollback if needed.
3.2 With incompatible state changes (state migration strategies).¶
Context¶
Preconditions / Checklist¶
Inputs / Parameters¶
Procedure¶
For stateful statements, it is necessary to bootstrap from history, which the below process accomplishes:
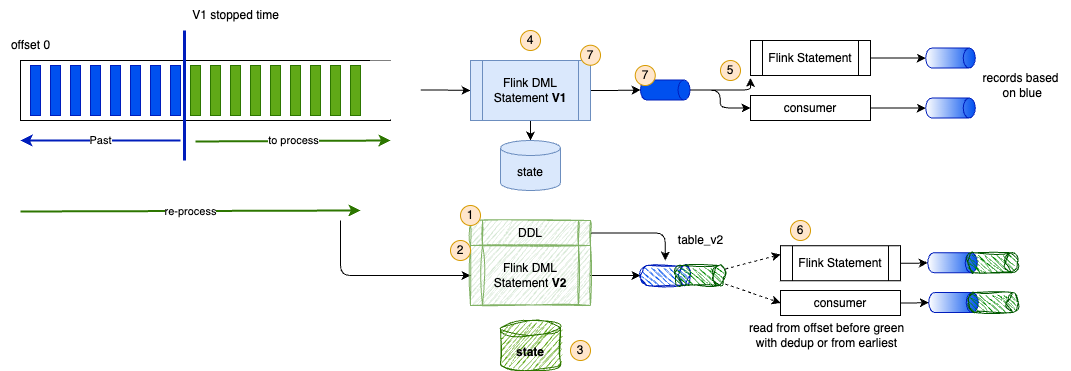
Figure: Stateful schema evolution process
The migration process consists of the following steps:
- Create a DDL statement to define the new schema for
table_v2which means topic v2. - Deploy the new statement with the v2 name, starting from the earliest records to ensure semantic consistency for the blue records, when they are stateful, or from the last offset when stateless.
- Once the new statement is running, it will build its own state and continue processing new records. Wait for it to retrieve the latest messages from the source tables before migrating existing consumers to the new table v2. The old blue records will be re-emitted. While the new statement
- Stop processing first statement.
- Halt any downstream consumers, retaining their offsets if those are stateless or idempotent, if they are stateful they will process from the earliest.
- Reconnect the consumers to the new table. For Flink statements acting as consumers, they will need to manage their own upgrades. To avoid duplicates or not missing records, the offset for the consumers to the new topic needs ot be carrefuly selected.
- Once all consumers have migrated to the new output topic, the original statement and output topic can be deprovisioned.
This process requires to centrally control the deployment of those pipelines.
Using Open Source Flink, creating a snapshot is one potential solution for restarting. However, if the DML logic has changed, it may not be possible to rebuild the DAG and the state for a significantly altered flow. Thus, in a managed service, the approach is to avoid using snapshots to restart the statements.
Also when the state size is too large, consider separating the new statement into a different compute pool than the older one.
Rollback¶
Gotchas¶
4- Scaling Jobs¶
4.1- Recipe: Scale a Flink Job to Handle Increased Load¶
Context¶
You see sustained backpressure in the Flink UI or high operator utilization, and the job is falling behind (increasing end-to-end latency, growing Kafka lag, etc.).
In Confluent Cloud for Flink it is possible to see some 'Compute Pool Exhausted' message on a query or with compute pool metrics. CFU is also correlated to the maximum number of statements that can run on a compute pool. Autoscaler can also need to scale above CFU max, and reports exhauted capability.
Preconditions / Checklist¶
Check that:
- The upstream system can support higher parallelism (e.g., Kafka topic partition count).
- The Flink cluster has or can get enough resources (TaskManagers, CPU/memory).
- Be sure to get telemetry on the Flink Cluster for CPU, network and disk I/O.
Inputs / Parameters¶
- Current job parallelism.
- Target parallelism.
- Environment details (e.g., Kubernetes deployment spec or managed configuration).
Procedure¶
-
Identify Bottleneck Operators. In Flink UI, look at:
- Backpressure tab (which subtasks are under pressure).
- Operator utilization and busy time.
- How much state does this pipeline have?
- Confirm where the bottleneck actually is (source, transformation, sink).
- Verify checkpoint frequency, backend system performance.
-
Verify External Constraints
- For Kafka sources:
- Ensure partitions ≥ desired parallelism.
- For sinks (databases, external systems) (Apache Flink, CP Flink):
- Check they can handle increased concurrency.
- For Kafka sources:
-
Plan Parallelism Change. Because job state is keyed, changing parallelism will usually require restart-from-savepoint:
- Trigger a savepoint.
- Cancel job (if required by your environment).
- Redeploy job with higher parallelism, restoring from that savepoint.
-
Adjust Cluster Resources
- If needed, scale out TaskManagers or underlying nodes/pods so that the job’s new parallelism can be scheduled.
- Update resource requests/limits to avoid CPU starvation or frequent OOMs.
- Deploy and Monitor
- Start the job from the savepoint with increased parallelism.
- Watch:
- Backpressure metrics.
- Throughput and lag.
- Checkpoint times (may change).
Validation¶
- Backpressure should reduce or disappear on the previously hot operators.
- End-to-end latency should drop or stabilize within target limits.
- No new bottleneck should appear elsewhere (e.g., sinks).
Rollback¶
If errors appear or performance worsens:
- Cancel the new deployment.
- Restore the previous parallelism from the same savepoint.
- Reevaluate resource allocation or code hot spots before attempting scale-out again.
4.2- Recipe: Handling backpressure and hot keys¶
Context¶
Use this recipe when backpressure persists after you have checked cluster or compute-pool capacity, or when one parallel subtask is near 100% busy while sibling subtasks are mostly idle (high data skew). Kafka lag, Messages Behind, and CFU exhaustion can be symptoms of skew, not only of undersizing.
Contrast with §4.1: raising parallelism does not redistribute work when a single key owns most of the traffic. Tuning guidance also states to fix skew before scaling — see Flink Tuning on Kubernetes.
Preconditions / Checklist¶
- Metrics available: Flink Web UI (OSS / CP Flink) or Query Profiler (Confluent Cloud).
- You know which operators are keyed (
GROUP BY, join keys, upsert / primary key, window key). - Kafka partition (bucket) counts for source topics are known.
- Baseline recorded before changes: lag or Messages Behind, backpressure %, busy %, data skew %.
Inputs / Parameters¶
- Job or statement id, current parallelism, and keyed columns.
- Observed skew and hottest subtask id (from UI or Query Profiler).
- Chosen remediation: key enrichment, salting, two-phase aggregation, or repartition after keys are balanced.
Procedure¶
-
Confirm skew versus capacity
- High skew plus one hot subtask: continue here.
- All subtasks hot and low skew: use §4.1.
-
Locate the hot operator
In the Flink Web UI, open the Backpressure view and compare busy time and data skew across subtasks. Metric definitions are in §2 Understanding the Flink UI. Note which operator sits immediately upstream of the backpressured edge.
Open the statement Query Profiler and inspect backpressure, busyness, and skew at task and operator level. See Query Profiler. Correlate with Messages Behind / pending records on the statement.
-
Identify the hot key(s)
Count records by the candidate key over a recent window (full-history counts can mislead during catch-up):
Order by
record_countdescending and look for keys that dominate. For percentile / z-score classification, see How to search for hot key?. -
Pick a remediation (ordered ladder)
Apply the lightest change that the business model allows:
- Enrich the key / add a dimension when a second column is available and correct for the aggregation or join (composite
GROUP BY, orDISTRIBUTED BY HASH(k1, k2)on sink tables). See partition and distribution notes. -
Salt hot keys for joins or aggregations: attach a salt, process locally, then merge on the original key. Example pattern (join on salted keys):
-- Local path: join / aggregate on (business_key, salt_id)
-- Global path: re-aggregate or upsert by business_key only
SELECT u.*, g.group_name
FROM users_salted u
JOIN groups_salted g
  ON u.group_id = g.id AND u.salt_id = g.salt_id
Lab scripts: code/flink-sql/04-2-joins/data_skew.
-
Pre-aggregate or split hot-key traffic onto a dedicated statement or topic so the main keyed operator stays balanced.
- Only after keys are more even, increase partitions and parallelism using §4.1.
- Enrich the key / add a dimension when a second column is available and correct for the aggregation or join (composite
-
Deploy and verify
- Logic or key changes on stateful statements follow statement evolution / savepoint practices in §3 Upgrading Jobs Safely.
- After deploy, watch skew %, backpressure, and lag for 10–15 minutes at steady state (not only during catch-up).
Validation¶
- Data skew drops on the previously hot operator.
- Backpressure falls across subtasks, not only as a job-level average.
- For salted paths: final merge restores correct global aggregates / upserts (no duplicates, no missing keys).
Rollback¶
- Revert to the previous statement or job version. On OSS / CP Flink with state, restore from the pre-change savepoint if the DAG is still compatible.
- If salting produced wrong results, stop the new statement, keep consumers on the prior sink, and discard or quarantine the salted output topic.
Gotchas¶
- Scaling past Kafka partition count does not raise source throughput; scaling a keyed operator does not help when one key owns the load.
- Salt without a final merge breaks global aggregates and upsert semantics. Prefer matching upsert / primary key and bucket key where possible (flink-sql-2).
- Null and default keys (
NULL,'',0,'unknown') are classic hot keys; fix upstream or route them explicitly. - Temporary skew during catch-up or backfill can look like a permanent hot key — wait for steady state before changing keys.
- Broader bottleneck triage (network, RocksDB, GC) remains in §7.2.
5- Backfills and Reprocessing¶
5.1- Recipe: Replaying Kafka topics from older offsets.¶
Context¶
You need to recompute results for a historical period (e.g., due to a code bug or schema issue), typically from Kafka-based sources. Remember to always assess if state needs to be done from the earliest records or not, according to the retention period. Kafka retention should be set so Flink reprocessing will give the correct output.
Preconditions / Checklist¶
- Kafka (or equivalent) retains the data for the desired backfill window.
- Downstream systems can accept re-ingestion or you have a separate backfill sink/topic.
- You know whether: Backfill should coexist with production job, or should better stop production job, run backfill, then resume.
- Access to
confluentcli for Confluent Cloud
Inputs / Parameters¶
- Source topics and partitions.
- Time/offset range for backfill.
- Desired output location (same sinks or separate backfill tables/topics).
- Expected data volume and runtime.
Procedure¶
-
Choose Backfill Strategy
- Separate backfill job: Same code base but different job name, reading from earlier offsets and writing to separate sinks.
- Repoint prod job: Temporarily rewind offsets and run against main sinks (riskier, requires idempotent sinks or dedupe).
-
Configure Source Start Position
-
For Kafka, configure a start offset or timestamp (e.g., “start from timestamp T0”).
-
Ensure the backfill job won’t auto-reset to latest if it hits errors.
-
-
Isolate or Protect Downstream
- Use dedicated output topics/tables for backfill where possible.
- If writing to prod sinks, ensure: Idempotency or deduplication and clear communication with consumers.
- Deploy Backfill Job
- Use a job configuration tuned for throughput (more parallelism, possibly looser latency constraints).
- Ensure checkpointing is still enabled (for large backfills) to allow restart.
- Monitor Runtime
- Monitor progress via Kafka lag and job metrics.
- Ensure not to starve the production job’s resources.
- Finalize
- When backfill completes: Either swap backfill data into prod tables (if using separate sinks) or mark backfilled period as complete.
- Turn off the backfill job.
Validation¶
- Check target sinks: Row counts, key distributions, and sample records match expectations.
- Check that no prolonged performance impact occurred on prod clusters.
Rollback / Contingency¶
- If backfill misbehaves (e.g., wrong logic), stop job and discard backfill outputs if isolated.
- For shared sinks, you may need a corrective cleanup step (e.g., delete or overwrite bad window).
5.2- Running temporary backfill jobs vs. reusing production pipelines.¶
Context¶
Preconditions / Checklist¶
Inputs / Parameters¶
Procedure¶
Rollback¶
Gotchas¶
6- Monitoring & Alerting¶
Context¶
To monitor Apache Flink production jobs effectively, you must establish an external observability pipeline utilizing external tools like Prometheus, Grafana, Datadog or Splunk. While the built-in Flink Web UI is excellent for real-time triage, it does not provide the historical data tracking or advanced alerting infrastructure needed to catch performance regressions or state degradation.
Confluent Cloud Flink metrics can be exported to any third-party tools like Prometheus and Grafana. See also the Metrics REST API
confluent-cloud-flink-workshop/flink-monitoring includes a Grafana dashboard for Confluent Cloud for Apache Flink and local Grafana + Prometheus setup you can run with Docker. See this repository deployment
Preconditions / Checklist¶
- Confluent: Deploy statements into one to many compute pools
- Get a service account, and API key/secret to access metrics
- Configure Prometheus with your Confluent Cloud API key/secret and Flink resource IDs, or copy the config from the Confluent Cloud Metrics integration UI.
- Deploy a Flink Application
- Use Web UI
6.1- Key metrics to watch (checkpointing, backpressure, task failures, JVM).¶
What to monitor in a custom Flink dashboard¶
In general the following are monitored for any product:
- Throughput / backlog: num_records_in, num_records_out, num_records_in_from_topics, pending_records
- Latency / timeliness: current_input_watermark_milliseconds, current_output_watermark_milliseconds, max_input_lateness_milliseconds.
- Failures / health: io.confluent.flink/statement_status.
- Task managers saturation: assess CPU usage %. Above 80% change scaling parameter.
- Checkpoint health serves as the absolute best proxy for the overall stability and throughput capacity of a stateful Flink application.
- lastCheckpointDuration: Track spikes in checkpoint time. If duration grows close to the checkpoint interval, checkpoints will queue up and stall your pipeline.
- lastCheckpointSize: Alert on linear, uncontrolled growth over time. This usually flags a state leak, an unbounded window, or a missing TTL configuration on a state backend.
- numberOfFailedCheckpoints: This value should ideally stay at zero. Investigate failures quickly because a lack of completed checkpoints risks catastrophic data loss if a hardware failure occurs.
- lastCheckpointAlignmentTime: Monitor this value to identify uneven performance. High alignment times show that upstream operators are sending data at unbalanced speeds
- Checkpoints are not expose to end-users
- Throughput / backlog: io.confluent.flink/num_records_in, io.confluent.flink/num_records_out, io.confluent.flink/num_records_in_from_topics, io.confluent.flink/pending_records.
- Compute pool saturation: compare current CFUs vs CFU limit for the pool; docs call this out as a best-practice alert.
The following fields are important to consider:
| Field | Why to consider |
|---|---|
| Status | Verify the state of the Flink query |
| Statement CFU | Server resource used by the statement. one CFU may process a throughput of 1000+ Records per second (RPS) |
| Messages Behind | Is the query behind, is there some backpressure applied. Messages Behind and Pending Records are the same metric with different names. This is the total amount of available records after the consumer offset in a Kafka partition across all operators |
| num_records_in | Total number of records this statement has received. |
| Message out | Rate of messages created by the query |
| State Size in GB | Keep it low, alert at 300+ GB |
| current_input_watermark_ms | The last watermark this statement has received (in milliseconds) for the given table. |
| current_output_watermark_ms | The last watermark this statement has produced (in milliseconds) to the given table. |
| cfu_minutes_consumed | The number of how many CFUs consumed since the last measurement |
| backpressure_time_ms_per_second | The amount of milliseconds this task has spent being backpressured |
| busy_time_ms_per_second | The amount of milliseconds this task has spent being busy |
Look at the statement status, consider failed, pending, degraded. Some issues are recoverables, some not:
| Recoverable | Non-recoverable | |
|---|---|---|
| User | Kafka topic deletion, loss of access to cloud resources | De/Serialization exception, arithmetic exception, any exception thrown in user code |
| System | checkpointing failure, networking disruption | |
| Actions | If recovery takes a long time or fails repeatedly, and if this is a user execption, the message will be in the status.detail of the statement, else the user may reach to the support. | User needs to fix the query or data. |
Be sure to enable cloud notifications and at least monitor topic consumer lag metric. As a general practices, monitoring for current_cfus vs cfu_limit to avoid exhaustion of compute pools.
The flink/pending.records is the most important metrics to consider. It corresponds to consumer lag in Kafka and “Messages Behind” in the Confluent Cloud UI. Monitor for high and increasing consumer lag.
At the Statement level we can get the following metrics over time:
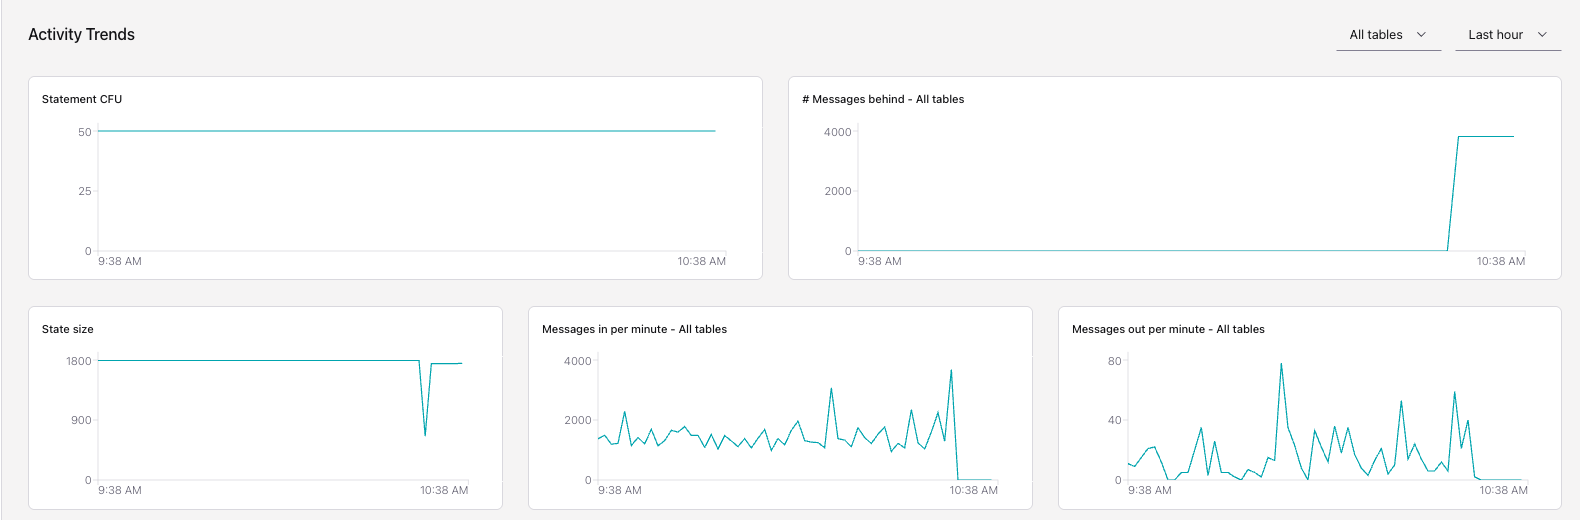
Max CFU per compute pools is a soft limit, but a hard limit per statement. This is not possible to set a limit of resource per statement, but it is still capped in the control plane.
6.2 Baseline dashboards and alerts.¶
Inputs / Parameters¶
Procedure¶
- Define new integration to monitoring platform.
- For Metrics REST API access, build a bearer token from the Key ID as the username and the Key Secret as the password.
- [Locally] Start docker compose. See the example in the deployment folder
Gotchas¶
- Some metrics over different time periods may not be accurate: for example looking at the
Last 24 hoursof message in and message out per minute, will have different value that thelast 6 hours. This is due to bining the message aggregation. The lower is the time period the more it is accurate.
7- Performance Testing¶
7.1 Establish a Performance Testing Platform¶
Context¶
Load testing Apache Flink applications requires a shift from traditional request-response testing to a stream-centric approach. Instead of testing concurrent users, you are testing sustained throughput, event-time latency, and state stability under pressure.
As any performance test, it is very import to decide what you’re optimizing for. Pick a primary goal per test run, which could be:
- Throughput (RPS / MBps) per Flink Application and per Kafka topic
- End‑to‑end latency: from source event time to sink
- Resource efficiency: CPU utilization state size, disk IO, network IO
If we take a classical shift left real-time processing architecture where Kafka topics and Flink jobs are used for building bronze, silver and gold records, it is possible to measure timestamps at different level:
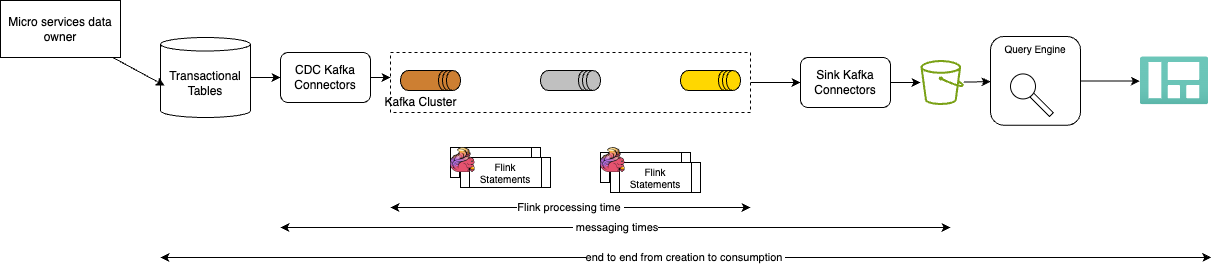
This diagram is important to support discussions about what latency means, and what and where to measure.
-
Throughput Testing
- As a baseline, the current benchmark, gave us that Flink can process ~10,000 records per second per CPU core. This baseline may decrease with larger messages, bigger state, key skew, or high number of distinct keys.
- Measure maximum processing rate (events/second)
- Evaluate parallel processing capabilities
-
Latency Testing
- Measure end-to-end processing latency
-
Scalability Testing
- Test horizontal scaling by assessing CFU increase up to the limit, control those statements to assess if we need to split them.
- Evaluate job manager performance
- Test with increasing data volumes
- Monitor resource utilization
Some Metrics to consider:
- Get time stamp when the Flink job is created
- Time stamp when the Flink SQL statement deployment is started and finished
- Time stamp when the LAG is processed
- Number of message per second processed per Flink statement
- Time stamp from source to destination for a given transaction
The following figures represents the different components for performance testing to deploy according to the target platform:
For Confluent Cloud the network may be part of the equation, depending on where you run the producer and consumer to measure performance.
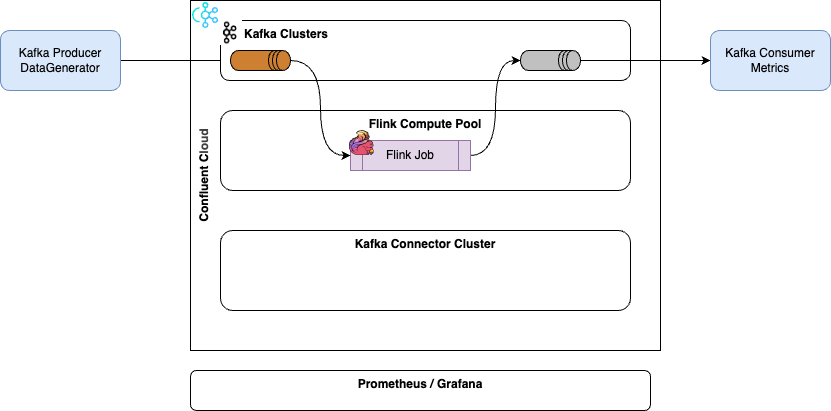
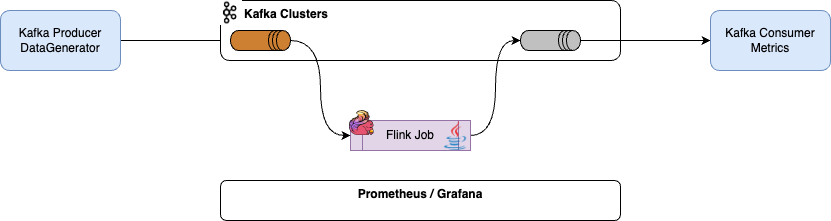
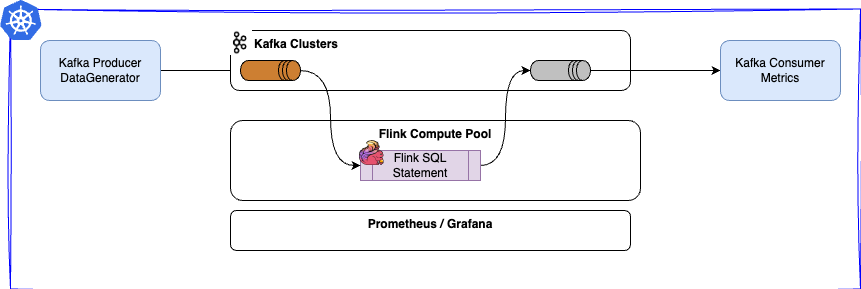
The following baseline abacus are used¶
- Typical Flink node configuration:
- 4 CPU cores with 16GB memory
- Should process 20-50 MB/s of data
- Jobs with significant state benefit from more memory
- Scaling Strategy: Scale vertically before horizontally
- Latency Impact on Resources: Lower latency requirements significantly increase resource needs:
- Sub-500ms latency: +50% CPU, frequent checkpoints (10s), boosted parallelism
- Sub-1s latency: +20% CPU, extra buffering memory, 30s checkpoints
- Sub-5s latency: +10% CPU, moderate buffering, 60s checkpoints
- Relaxed latency (>5s): Standard resource allocation
Preconditions / Checklist¶
You need to have access to:
- Kafka cluster with 1-3 topics, 42 partitions - Kafka cluster size is a minimum of 3 nodes.
-
Data generator producer apps able to send 1-7kb messages at a 40-500k messages / sec. The goal is to have a lot of unique keys (30G) to generate big 210GB of state. As part of the testing, there will be joins operator, so the schema should include foreign keys. For platform test, a schema may look like:
timestamp: long - unix timestamp
record_id: long - incrementing record number
user_id: long - for something to key by
cat_id: long – for something else to key by
group_id: long – for more to key by
payload: string – to make a record big or large.
You can use the producer performance test
Kafka-producer-perf-test.shto simulate load on a Kafka topic. The tool is located in the bin/ directory of your Kafka installation. See the Confluent video for Kafka producer hands-on. -
Some Flink job to use as benchmark, for platform sizing purpose, or the real production flink job for job performance asssessment. Use a small set of canonical queries that mirror real jobs and map to known internal benchmarks:
- Stateless 1:1 transform: baseline max throughput; typically Kafka IO/partitions are the bottleneck, not Flink
- CPU‑heavy stateless transform (e.g., string/JSON/UDF heavy): traditionally it is CPU bound
- Joins & aggregations with realistic key cardinality and state size: state access pattern dominates throughput.
- If you use remote UDFs, include a UDF‑heavy workload; be aware that batching and RPC overhead dominate there
-
Be sure to have metrics and dashboard in place.
Procedure¶
- Create Kafka Topics for Test
- Calibrate data generator
-
Launch benchmarking job
- Example of SQL query for stateful processing:
 INSERT INTO SinkTable
        SELECT
            `user_id`,
            COUNT(*) AS `event_count`,
            ROW(
                LAST_VALUE(`timestamp`),
                LAST_VALUE(`record_id`),
                LAST_VALUE(`cat_id`),
                LAST_VALUE(`group_id`),
                LAST_VALUE(CAST(`payload` AS VARCHAR))
            ) AS `last_record`
        FROM TABLE(
            TUMBLE(TABLE SourceTable, DESCRIPTOR(proc_time), INTERVAL '5' MINUTES)
        )
        GROUP BY `user_id`, `window_start`, `window_end`;
- Example of SQL query for stateful processing:
-
Use Flink Console to assess job metrics
- Use Grafana dashboard
- Validating the disk speed for worker node
Gotchas¶
- See Apache Flink performance tuning chapter
- See the end-to-end demonstration for perf testing in this repo.
7.2- Identifying bottlenecks (sources, network, RocksDB).¶
Context¶
Use this recipe when throughput or latency SLOs are missed and the root cause is unclear. Symptoms include sustained backpressure, growing checkpoint duration, or single subtasks at 100% utilization while others are idle.
The full symptom-to-diagnosis playbook with observability stack guidance is in Flink Tuning on Kubernetes §9.
Preconditions / Checklist¶
- Flink Web UI or Prometheus metrics available.
- Baseline checkpoint history and consumer lag recorded.
Procedure¶
- Open Flink UI → Backpressure tab; note red operators and subtask skew.
- Check Checkpoints → History for duration vs interval.
- Use the bottleneck table in flink_app_tuning.md §9 to map symptoms to first tuning knob.
- Apply one change; re-measure before proceeding.
Rollback¶
Revert the last configuration change; redeploy from savepoint if stateful.
Gotchas¶
- Scaling parallelism before fixing hot keys wastes resources.
- See Architecture cookbook for metric definitions.
7.3- GC/memory tuning, network/shuffle tuning.¶
Context¶
Use when TaskManagers show GC pauses, OOMKilled events, or shuffle-related backpressure with low CPU. These issues often trace to misaligned Flink process memory, managed memory, or network buffer settings on Kubernetes.
Detailed recipes and configuration keys are in Flink Tuning on Kubernetes §3, §7, and §8.
Preconditions / Checklist¶
- JVM GC metrics or logs available (
Status.JVM.GarbageCollector.*). - Pod memory limits and
taskmanager.memory.process.sizedocumented.
Procedure¶
- For GC pressure: rebalance heap vs managed memory (§3); align pod limits with process size (§2).
- For direct buffer OOM or shuffle backpressure: tune
taskmanager.network.memory.*(§7). - For RocksDB disk thrashing: increase managed memory and block cache (§3, §6).
Rollback¶
Revert memory and network settings; redeploy from savepoint if required.
Gotchas¶
- Network memory increases reduce heap or managed memory unless total process size grows.
- See Cluster management §1.0 for the TaskManager memory diagram.
8- Common Incident Recipes¶
See Confluent Product documentation for troubleshoot Flink SQL statements and how to guide - Resolve common query problems.
8.1 Job stuck in “restarting” or “failing” loop.¶
Context¶
A job repeatedly fails and auto-restarts due to its restart strategy, causing instability and potentially thrashing external systems.
Preconditions / Checklist¶
- You can modify job configuration or redeploy.
- You have access to logs and metrics.
Inputs / Parameters¶
- JOB_ID.
- Recent error stack traces.
- Restart strategy configuration.
Procedure¶
- Pause/Limit Damage if Needed
- If the job is causing harm (e.g., hammering a DB, producing corrupt data), consider:
- Lowering restart frequency temporarily (update restart strategy), or
- Cancelling the job until you understand the issue.
- If the job is causing harm (e.g., hammering a DB, producing corrupt data), consider:
- Identify Root Error
- From Flink UI or logs, capture the exception causing the failure.
- Is it data-related (bad record)?
- External system (timeout, 429/500 responses)?
- Program bug (NPE, etc.)?
- From Flink UI or logs, capture the exception causing the failure.
- Classify Incident
- Data/record issue: maybe a single poison pill message.
- Infrastructure issue: external system down/slow.
- Code bug: deterministic exception for some input.
- Choose Temporary Mitigation
- Data/record issue: Implement dead-letter queue mechanism or filtering, redeploy job.
- Infrastructure issue: Throttle load, increase timeouts, or temporarily disable sink.
- Code bug: Hotfix code in staging → redeploy from last savepoint.
- Redeploy from Last Known Good State
- Use the most recent successful checkpoint or savepoint before the incident.
- Ensure that the new version handles the problematic condition.
Validation¶
- Job stays in RUNNING state over your defined stability window.
- Alerts for repeated failures clear.
Rollback¶
If hotfix fails, roll back to last known good version with a mitigation that avoids the triggering condition (e.g., filtering the offending key).
8.2- Recipe: Handling Persistent Checkpoint Failures¶
Context¶
You’re seeing alerts that a job’s checkpoints are failing for several consecutive attempts, or the Flink UI shows repeated checkpoint failures. Prolonged failure threatens your ability to recover reliably and meet recovery SLOs.
Preconditions / Checklist¶
Access to: * Flink Web UI. * Logs for JobManager and TaskManagers. * State backend storage system (e.g., S3/GCS/HDFS). * Know the job’s criticality and tolerated downtime (can you pause input or not?).
Inputs / Parameters¶
- Job name / JOB_ID.
- Time window of failures.
- Checkpoint directory URI (from job config).
Procedure¶
- Inspect Failure Reason in Flink UI: In the job’s Checkpoints tab, open a failed checkpoint and note the error:
- Storage-related (e.g., permission denied, quota exceeded).
- Timeout / slow I/O.
- Operator-specific errors during snapshot.
- Serialization errors.
- Check Storage Health: If errors mention the state backend or filesystem:
- Attempt a small write/read manually to the checkpoint directory from a node or pod with similar permissions.
- Verify IAM/ACLs, quotas, and recent infra changes.
-
Check Operator Logs
- Look for stack traces near checkpoint failure times.
- If a specific operator is failing snapshot, note which one (e.g., custom sink, third-party connector).
-
Validate Checkpointing Configuration
- Are you trying to checkpoint too frequently for your workload?
- Compare: 1/ Checkpoint interval vs. average checkpoint duration. 2/ Size of checkpoints (state size growth trend).
- Immediate Stabilization Options. Depending on what you found:
- Storage issue: fix permissions/quotas; once resolved, checkpointing should resume without job restart.
- Timeout / too heavy:
- Temporarily increase checkpoint timeout.
- Increase interval to reduce pressure.
- Operator-specific bug:
- Decide whether to temporarily disable that operator, hotfix its code, or deploy a version that bypasses the failing path.
- When Job is Unstable: Consider taking a manual savepoint (if still possible) or stopping ingest (e.g., pausing Kafka consumer, if your environment supports it), then restarting from the last successful checkpoint/savepoint.
Validation¶
- Check that new checkpoints complete successfully over at least a few consecutive attempts.
- Monitor checkpoint duration and size for stability.
Rollback / Contingency¶
If your configuration changes worsen things:
- Revert checkpoint interval/timeout to previous values.
- If no quick fix is available, escalate: consider pausing job input or taking it offline with communication to downstream consumers.
Gotchas¶
- Changes in upstream schema or data volume spikes can indirectly cause checkpoint issues (e.g., bigger state, slower snapshots).
- If using a shared object store, another workload may have changed performance characteristics.
8.3 State corruption or version mismatch.¶
Context¶
Preconditions / Checklist¶
Inputs / Parameters¶
Procedure¶
Rollback¶
Gotchas¶
8.4 Flink SQL debugging¶
Context¶
With a higher level of abstraction, the tools to assess SQL statements executions are different then pure Java based streaming processing. In this section we will review the practices and tools to assess Flink SQL statement in the context of Confluent Cloud in general and self-managed Flink deployment when relevant.
Statement Lifecycle¶
| State | Meaning | Action |
|---|---|---|
| PENDING | Waiting for CFUs | Check compute pool utilization |
| RUNNING | Actively processing | Monitor lag, watermarks, state size, throughput |
| COMPLETED | Finished (DDL/bounded) | Normal for one-time operations |
| FAILED | Unrecoverable error | Check logs, fix root cause |
| DEGRADED | Checkpointing failing | Investigate state growth or resources |
| STOPPED | Manually stopped | Resume or delete |
Preconditions / Checklist¶
- For Confluent Cloud: access to the console and being able to use Flink workspace
Inputs¶
The following components are used for assessing Flink statement issues
-
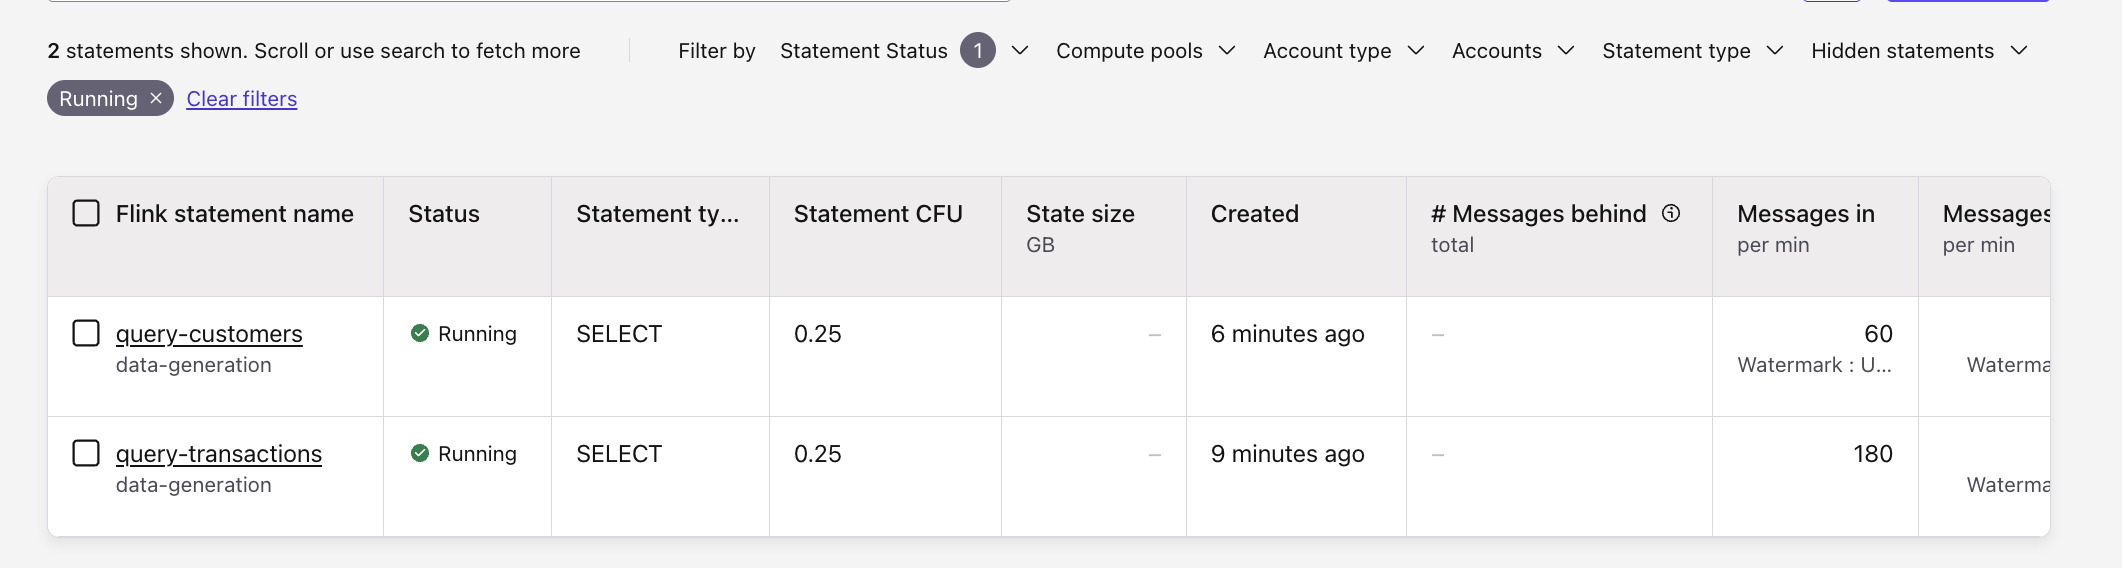
Cloud Console -> Flink for Statements list and status per statement. In this view the important columns are:
- Status: Current state
- Messages Behind: Consumer lag (0 = healthy, growing = problem)
- Messages In/Out: Throughput + source/sink watermarks
- CFU: Resource consumption
- Time Created: How long it's been running
-
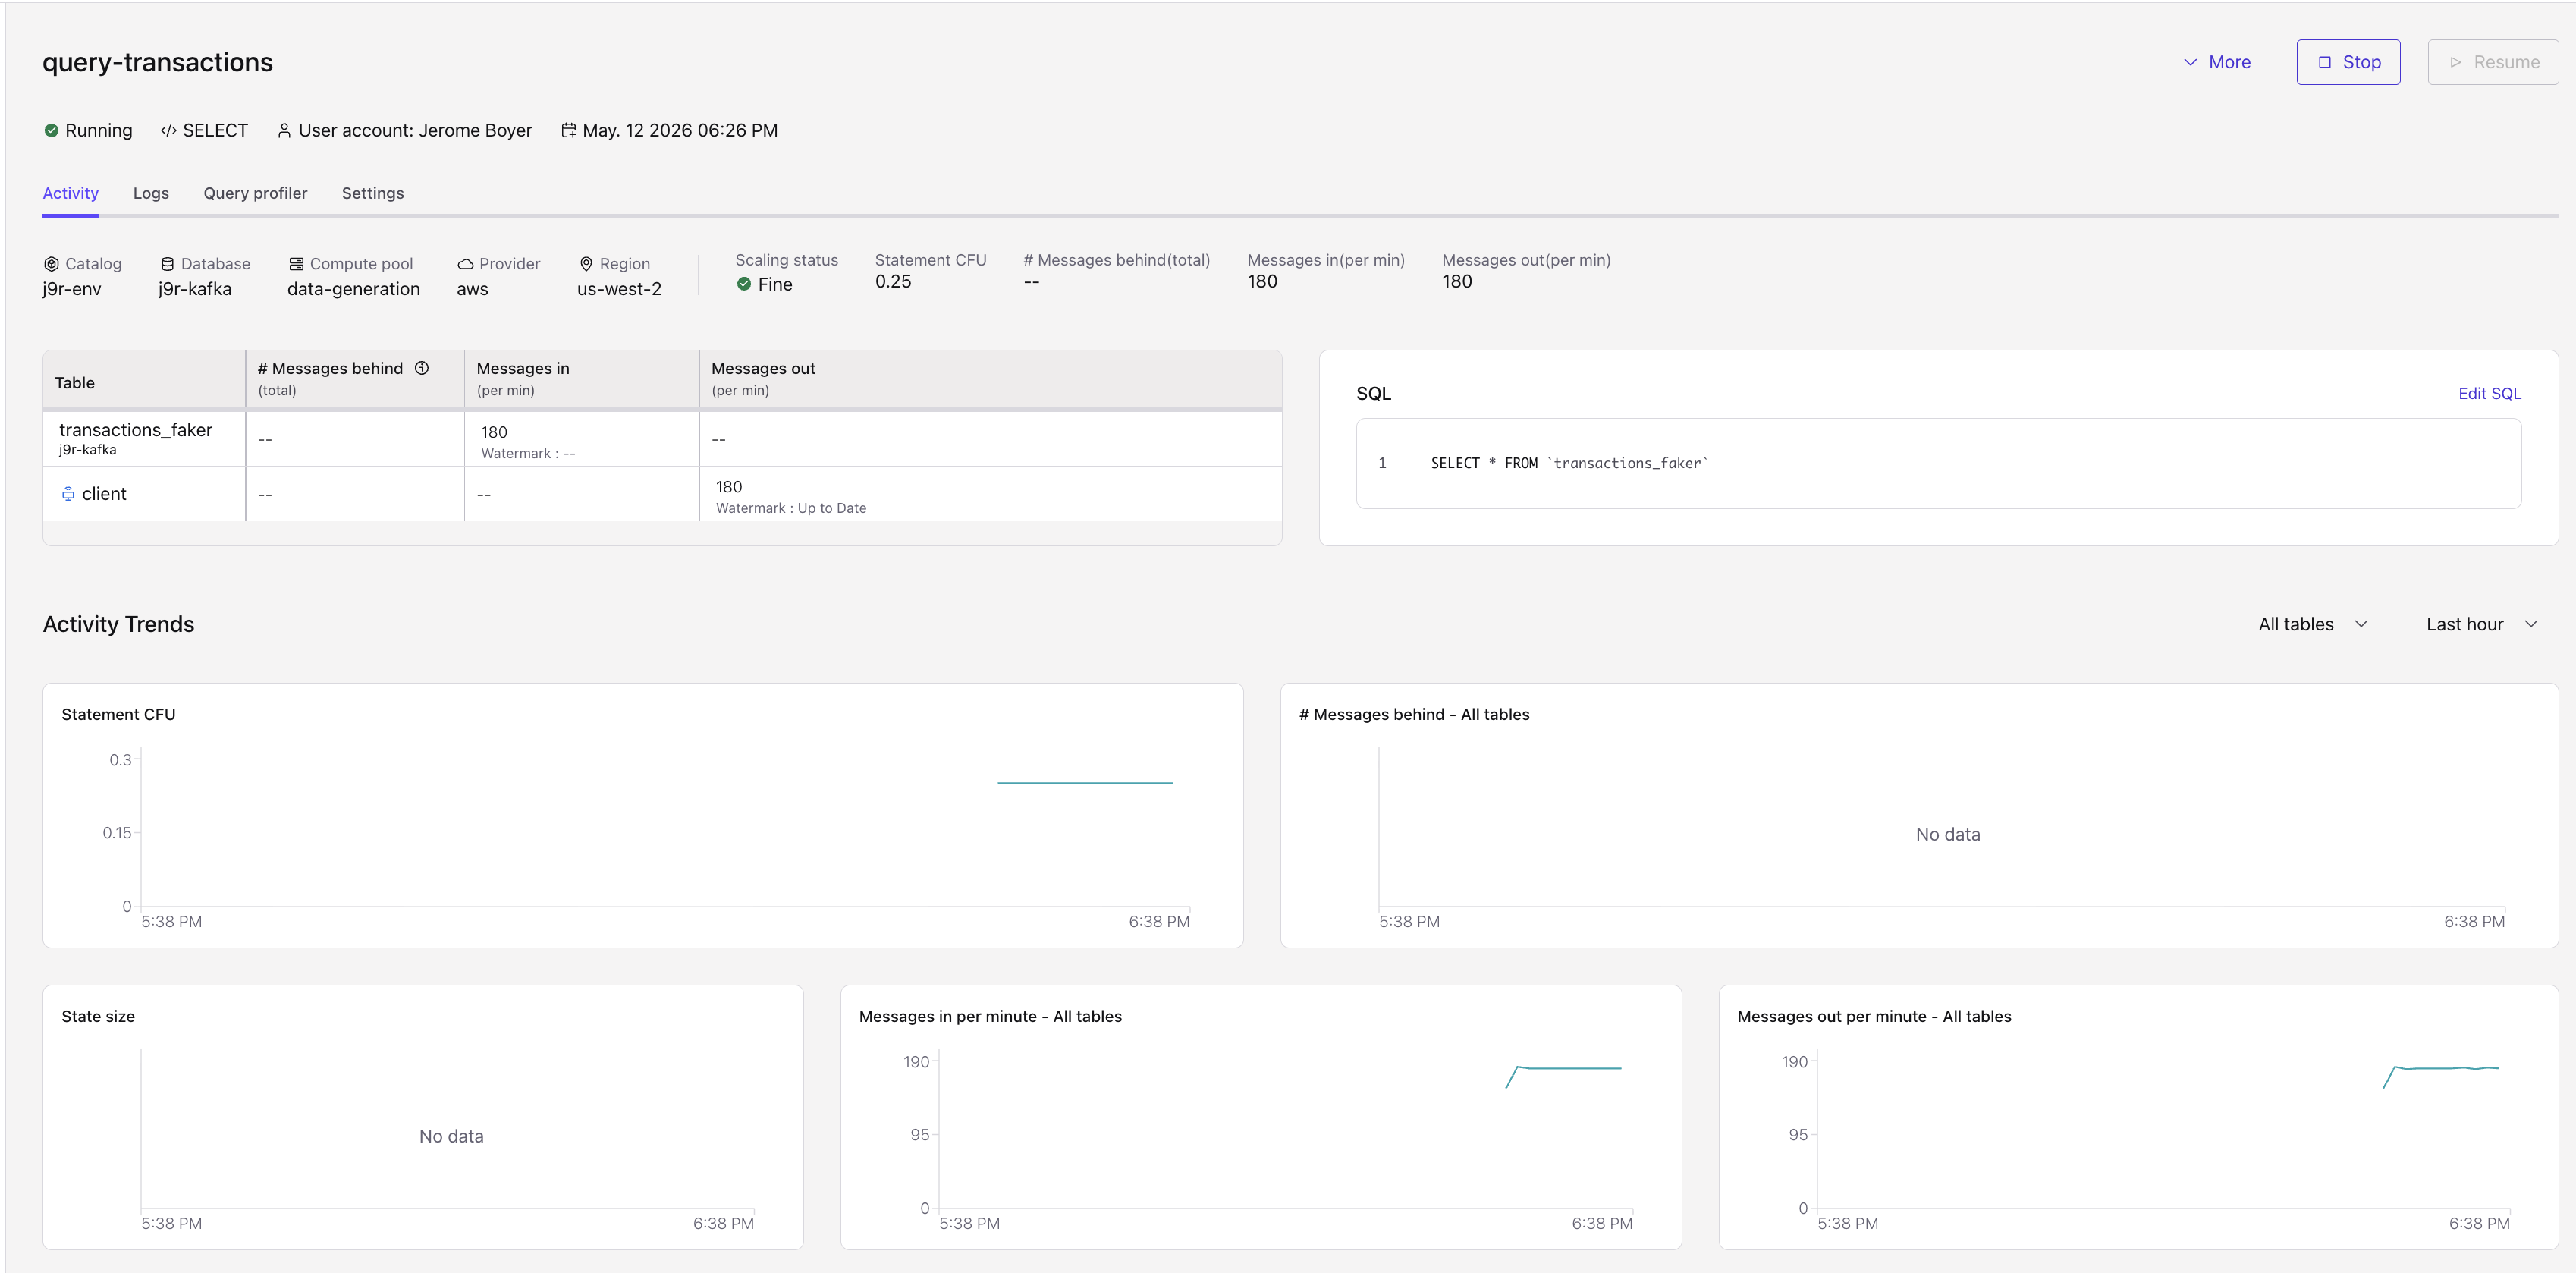
Cloud Console -> Flink Detail panel to assess current metrics for a given statement. Same metrics as above with time plotting figures.
- Assess the watermark progression
- Review the CFU consumption over time to assess scaling capability. When there is high CFU usage with low throughput, it demonstrates a query ineffiency.
-
Query Profiler (real-time visual monitoring)
-
Run
EXPLAINquery to get the execution plan: Flink shows the Physical Plan of the query, which comprises all the operators Flink will use to execute your query. Look at operators with potentially state-intensive which has no TTL applied, like joins: -
Metrics API
- Snapshot queries for state inspection
Procedure¶
- Identify the common patterns: